The Insight Finder
The Insight Finder is at the heart of Vespucci. It's a powerful statistical tool that lets you identify at a glance the elements that are likely to affect the probability of your user adopting the behavior you've described in your or your story.
The Insight Finder is organized into three tabs (please note that the order of appearance of these tabs varies according to your tracking plan).
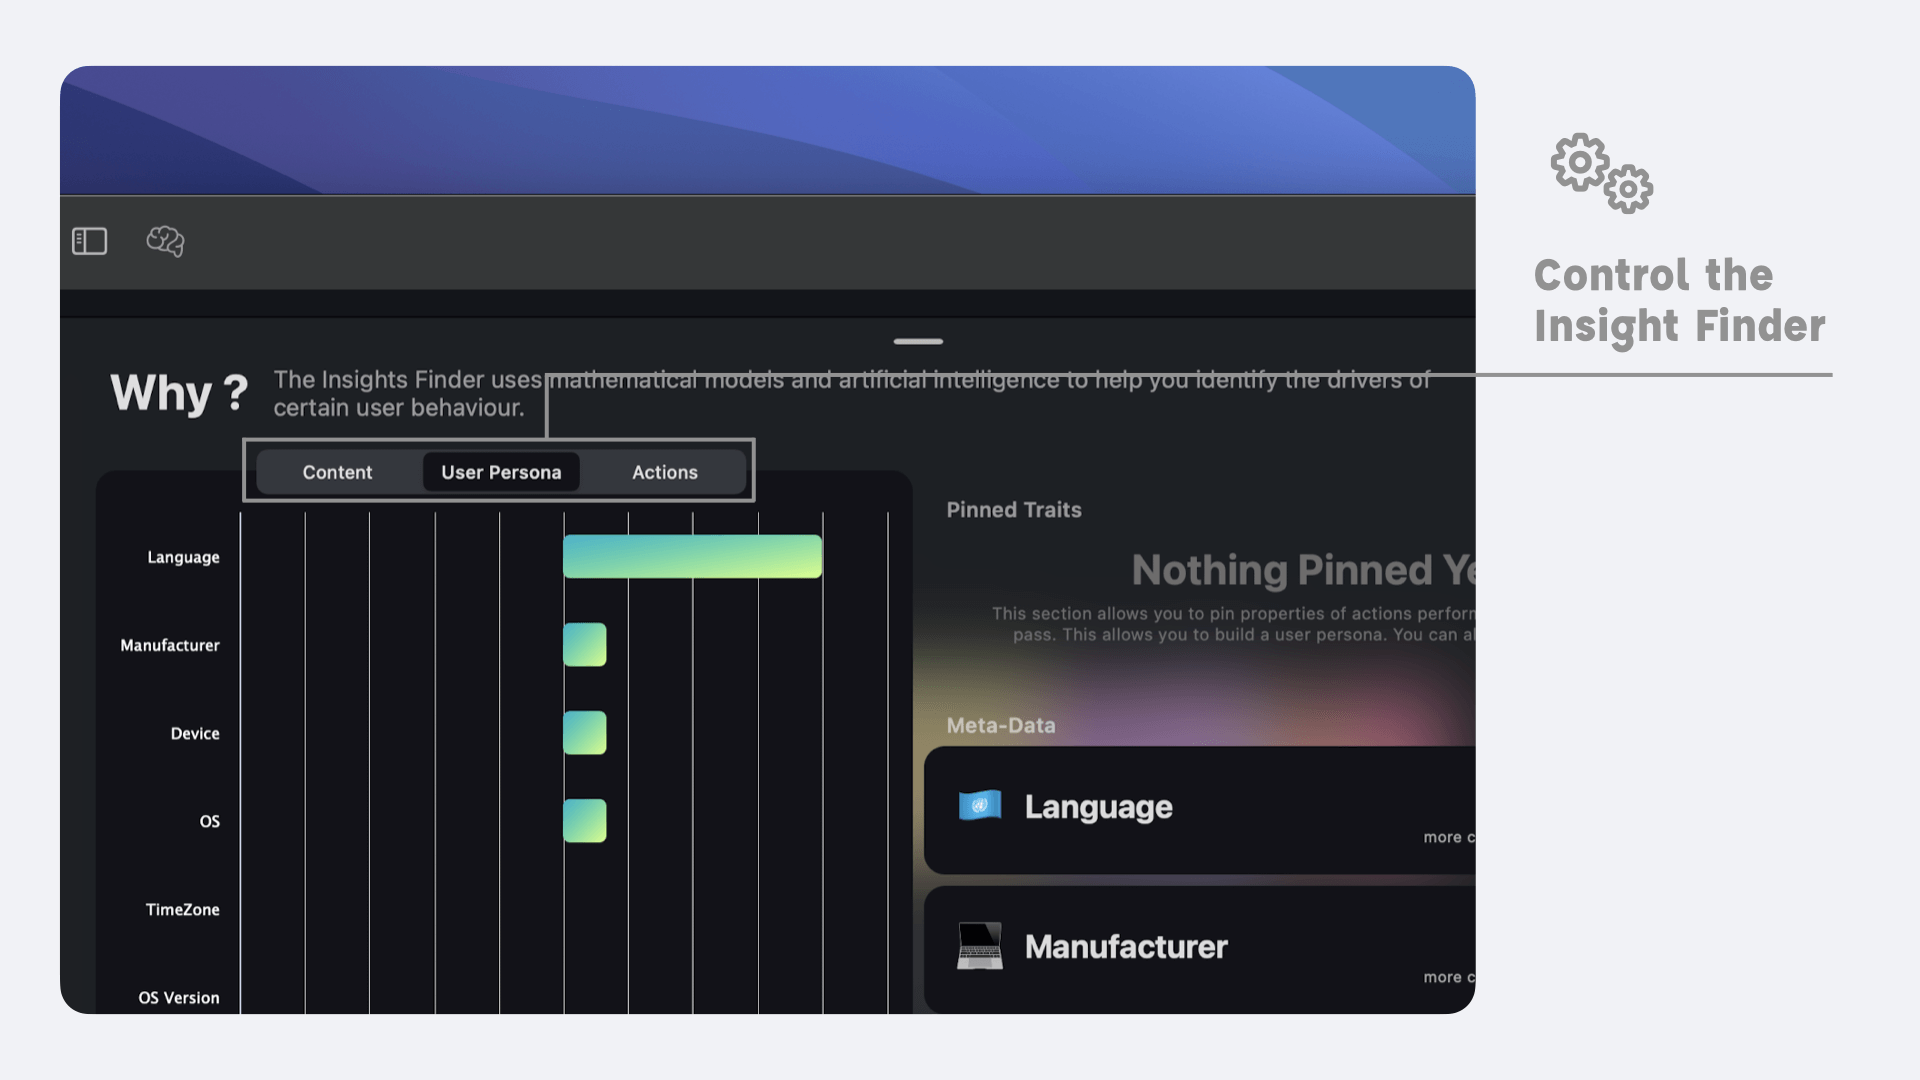
- (i) The first tab, entitled "Content", helps you identify the extent to which the content of your product (i.e. elements of your UX that are not initialized by a user) is likely to influence the likelihood of your story coming to fruition.
- (ii) The second tab, entitled "User Persona", focuses on your user's specific characteristics: the device they use, their location and much more. You can customize this section to suit your tracking plan; we'll explain how in the next section.
- (iii) Finally, the last tab, entitled "Actions", looks at how the actions performed by your users in the past are likely to affect the probability of your story being realized.
Segment your user base
The subject of user segmentation is vast. To show you why it's important and how you can use it to build better products, we're going to present this doc as two cases. They are adapted from the experiences of other Vespucci users.
First, let me introduce you to Sam. Sam is product manager for a photo content creation app. He knows that his app is used by very different audiences. "casuals" users use his product to enhance their vacation photos. More professional users use his product to highlight items on their drop-shipping sites, while professional photographers use the app as a mini-photo studio on the move.
Let me now tell you about Paul. Paul is in charge of growth for a rather unusual e-commerce platform. It sells and delivers semi-customized meals for pets. These are prepared on the basis of menus compiled from a questionnaire containing information such as the animal's breed, weight and age. Let's find out how Sam and Paul can use Vespucci to segment their user base, and how they can use this segmentation to build better products and extract more value. The first step is to make sure they have the right tracking plan.
Build the right tracking plan.
A key element to consider and possibly adapt is the tracking plan. Let's see how our two PMs went about it. Sam modified the application to quickly learn more from its users. To do this, he included in the onboarding process a succession of views inviting users to describe themselves.
This succession of questions can quickly become a source of friction for users. Some may perceive these questions as intrusive, while others may be bored by a lengthy onboarding process. So be sure to design an engaging interface (you might also consider including a few gamification elements), inviting precise but not personal answers. At the end of this questionnaire, Sam sends an Amplitude event (called "Onboarding Completed") to which he has associated the questions asked during the onboarding as properties. The value associated with each of these properties is, of course, the answer given by the user.
For Paul, the job was easier. In fact, his product already included a whole series of pet-related questions. All he had to do was add a Segment event (yes, Paul uses Segment while Sam uses Amplitude only) entitled "New Pet". This event takes as its properties all the characteristics of the registered pet (weight, breed, age...).
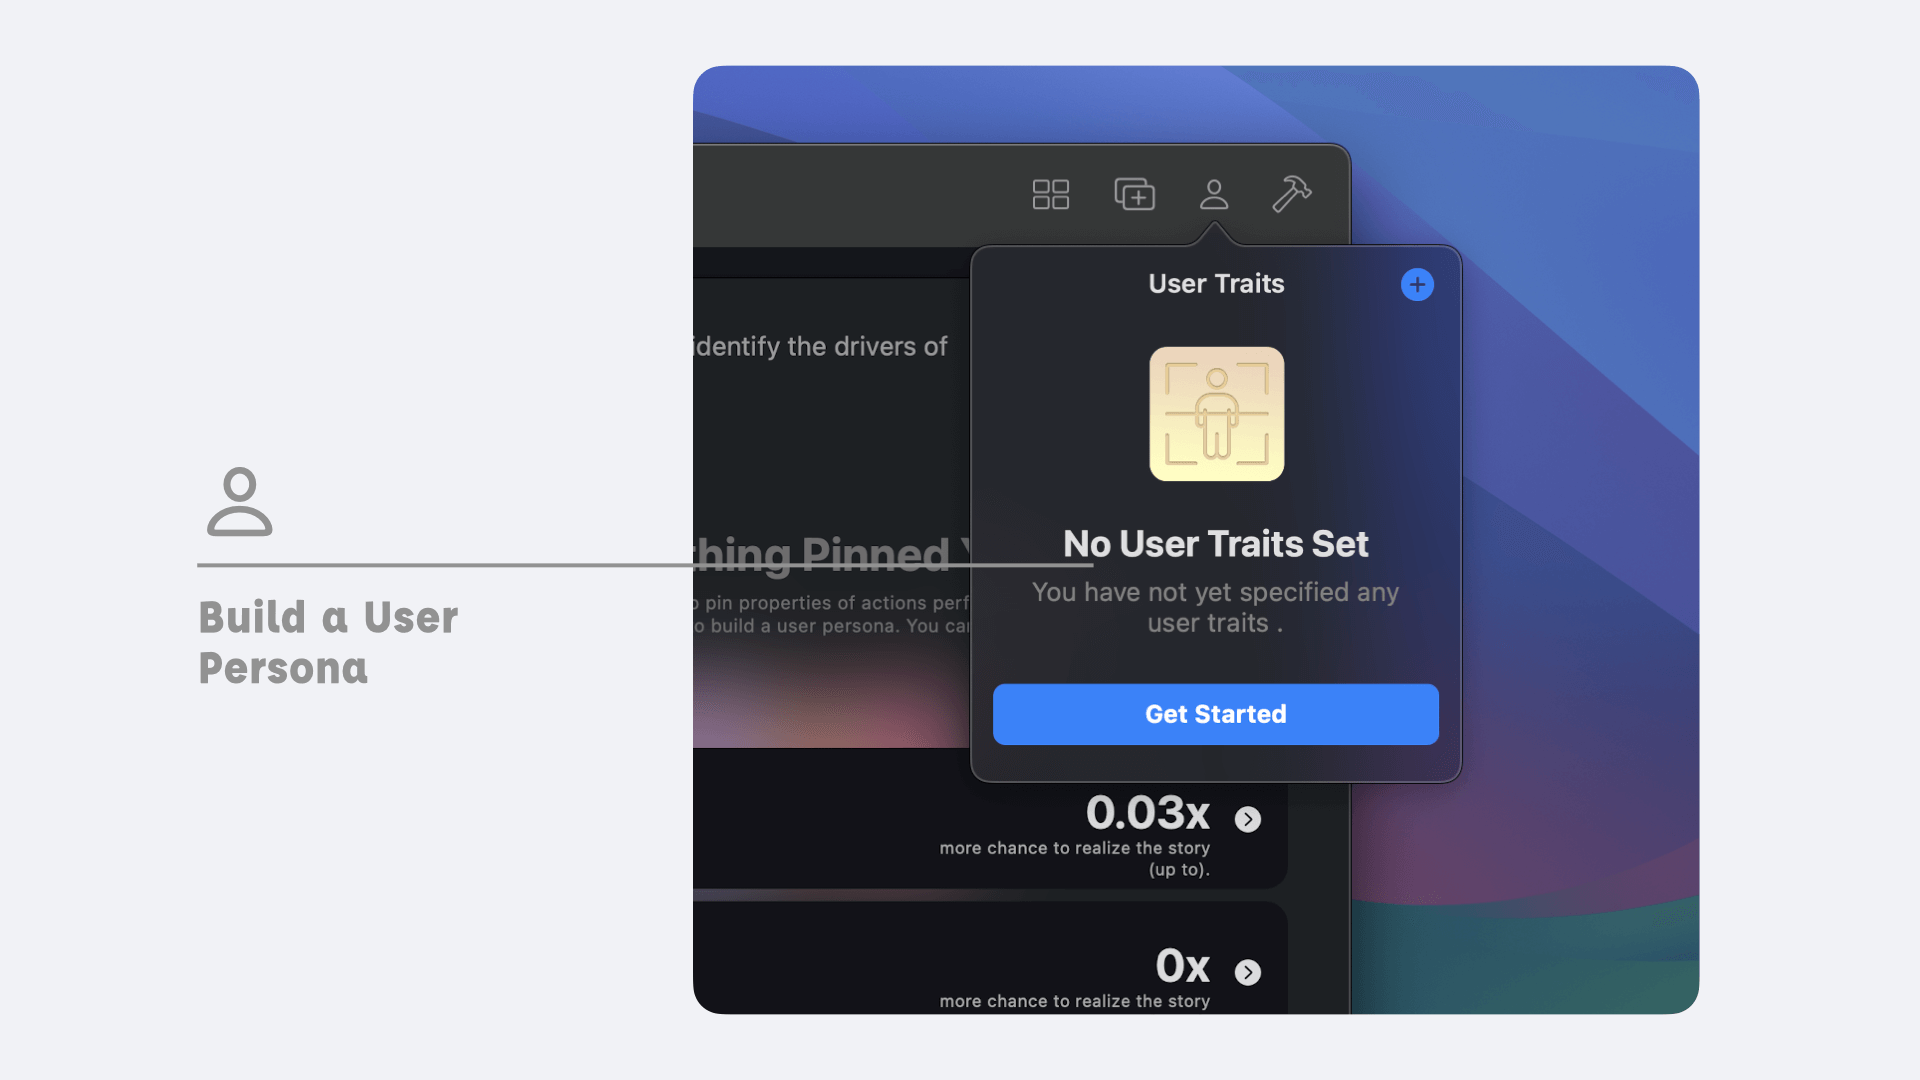
Build a persona.
To define the persona, go to the Insigth Finder, in the persona tab. In the top right-hand corner, you'll see a "+" button. Click on the "+" to bring up a popover listing the properties of your tagging plan. Select the ones that seem to be good candidates for a "robot portrait" of your users. In Sam's case, for example, these are all the questions asked during onboarding and attached to the "Onboarding Completed" event, while in Paul's case they are all the properties attached to the "New Pet" event.
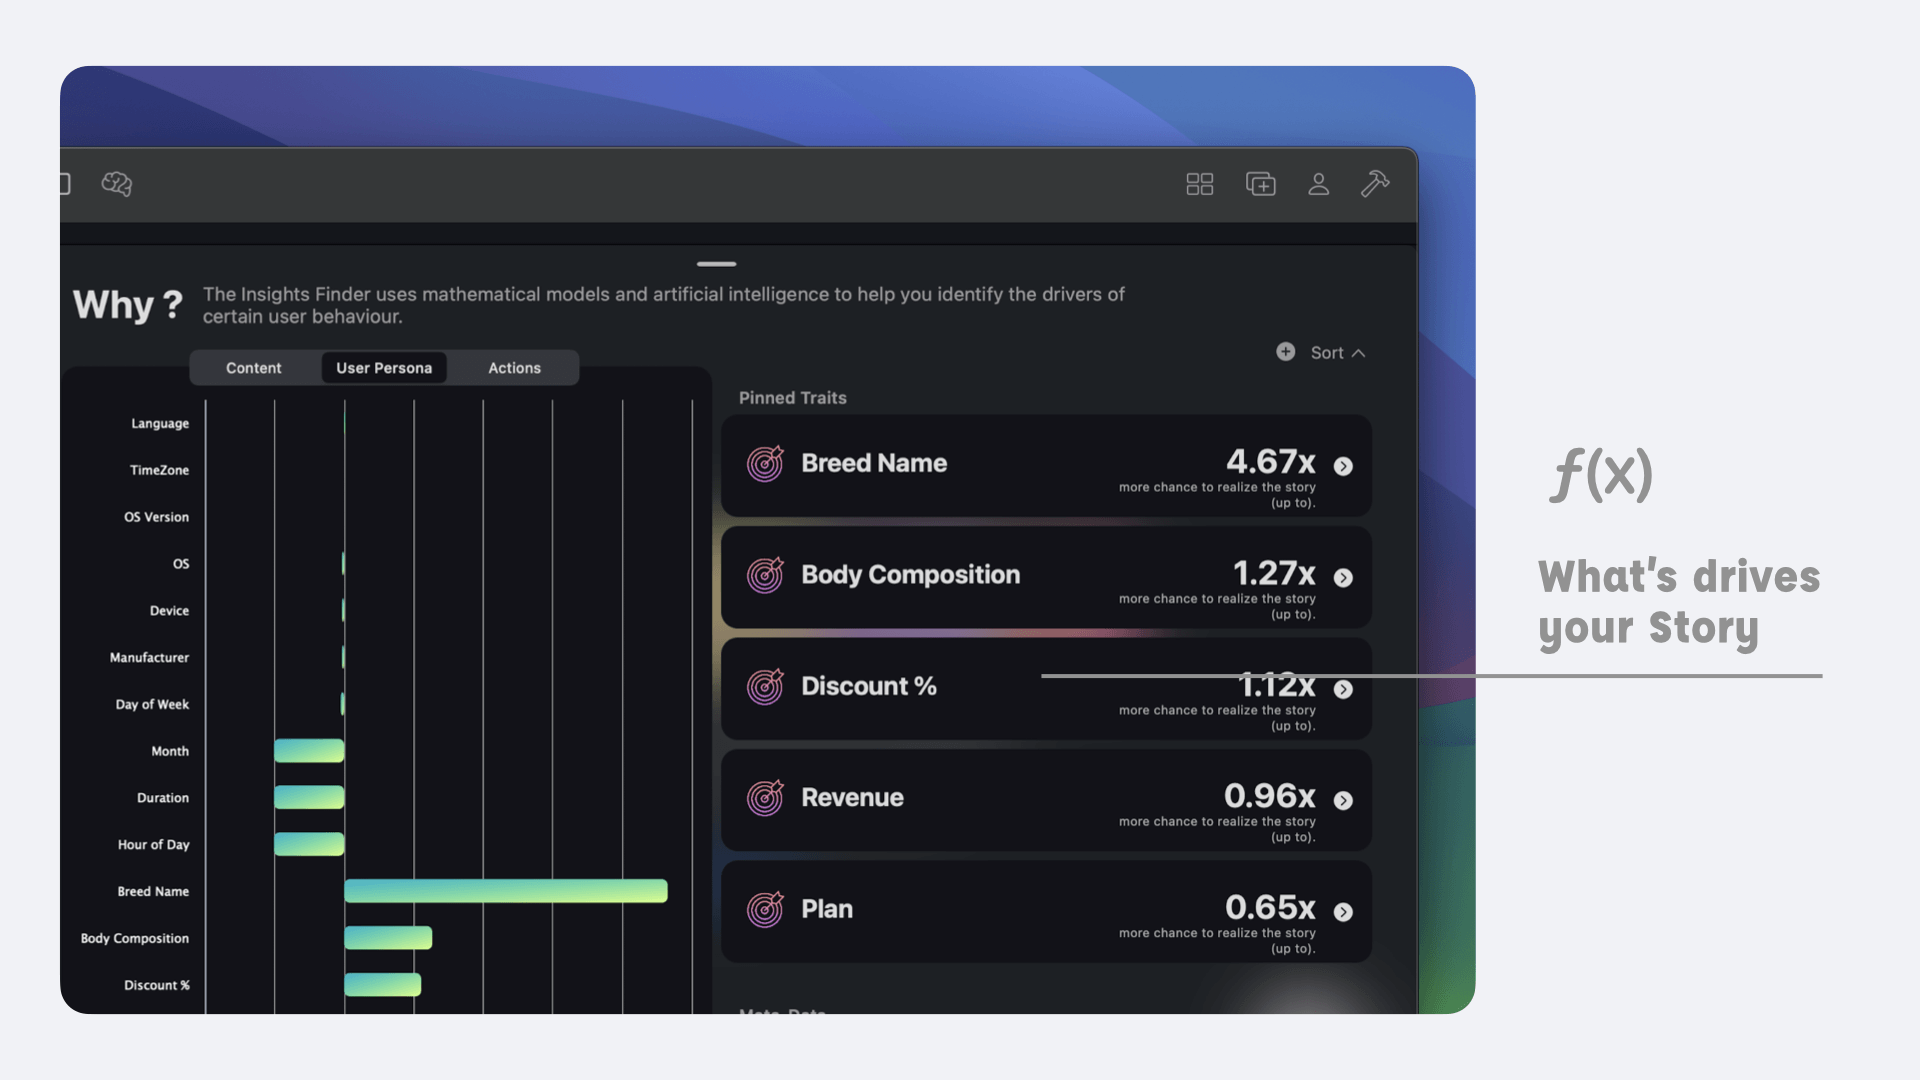
Vespucci will then calculates an associated probability for each of these characteristics. This makes it possible to provide Sam with analyses such as "casuals" users are 70% less likely than the average to convert to a paid plan. Moreover, these users are 60% less likely to use the calorimetry functions during the free trial. It would therefore seem that these users are not ready to subscribe (the subscription is available on an annual or quarterly basis) for a period of use as short as, say, a trip. Paul, for his part, determined that owners of small cats had a much greater tendency to churn than the average.
Thanks to Vespucci's findings, Paul has worked with the production team to propose an offer better suited to smaller cats. As for Sam, he was able to propose a new price plan specially designed for amateur users. This price plan allows weekly subscriptions and does not include analysis and color correction of photos from the photo library. This is a good positioning for Sam, as it enables him to monetize users who previously did not pay. What's more, these users benefit from a better experience at a lower price. Finally, Sam has been able to preserve its profitability by not 'relying on a costly process (as it relies on a Google Cloud Platform api) without compromising the quality of its product for the target audience.